Crypto Narratives: Relative Strength V2Simple Indicator that displays the relative strength of 8 Key narratives against BTC as "Spaghetti" chart. The chart plots an aggregated RSI value for the 5 highest Market Cap cryopto's within each relevant narrative. The chart plots a 14 period SMA RSI for each narrative.
Functionality:
The indicator calculates the average RSI values for the current leading tokens associated with ten different crypto narratives:
- AI (Artificial Intelligence)
- DeFi (Decentralized Finance)
- Memes
- Gaming
- Level 1 (Layer 1 Protocols)
- AI Agents
- Storage/DePin
- RWA (Real-World Assets)
- BTC
Usage Notes:
The 5 crypto coins should be regularly checked and updated (in the script) by overtyping the current values from Rows 24 - 92 to ensure that you are using the up to date list of highest marketcap coins (or coins of your choosing).
The 14 period SMA can be changed in the indicator settings.
The indicator resets every 24 hours and is set to UTC+10. This can be changed by editing the script line 19 and changing the value of "resetHour = 1" to whatever value works for your timezone.
There is also a Rate of Change table that details the % rate of change of each narrative against BTC
Horizontal lines have been included to provide an indication of overbought and oversold levels.
The upper and lower horizontal line (overbought and oversold) can be adjusted through the settings.
The line width, and label offset can be customised through the input options.
Alerts can be set to triggered when a narrative's RSI crosses above the overbought level or below the oversold level. The alerts include the narrative name, RSI value, and the RSI level.
在腳本中搜尋"relative strength"

RSI Signal Pro[UgurTash]Introducing RSI Signal Pro for TradingView
RSI Signal Pro is a refined version of the standard Relative Strength Index (RSI) , designed to improve signal accuracy by generating alerts in real-time instead of waiting for multiple candle confirmations. This enhancement allows traders to react faster to market movements while maintaining the familiar RSI structure.
What Makes RSI Signal Pro Unique?
✅ Real-Time RSI Signals: Unlike the traditional RSI, which waits for candle confirmations, this version provides immediate buy and sell signals upon key level crossovers.
✅ Dual Trading Modes: Choose between Simple Mode (standard RSI crossovers) and Advanced Mode (momentum-adjusted signals with price validation).
✅ Customizable RSI-Based Moving Average (MA): Optionally apply SMA, EMA, WMA, or VWMA to smooth RSI fluctuations and identify longer-term trends.
✅ Adaptive Signal Filtering: The Advanced Mode reduces false signals by filtering RSI movements with a momentum threshold and historical RSI validation.
✅ User-Friendly Interface: Simple ON/OFF toggles allow easy customization of the indicator's behavior.
How This Indicator Works
🔹 Simple Mode: Identical to traditional RSI, triggering signals when RSI crosses 30 (bullish) or 70 (bearish).
🔹 Advanced Mode: Uses historical RSI pivots, momentum verification, and price confirmation to refine signal accuracy—ideal for traders looking for more precise entries.
🔹 RSI-Based MA: Optionally overlay moving averages onto the RSI, providing additional trend confirmation.
How to Use RSI Signal Pro
1️⃣ Select a mode: Use Simple Mode for frequent alerts or Advanced Mode for refined signals.
2️⃣ Enable RSI-Based MA: Apply SMA, EMA, WMA, or VWMA to smooth RSI fluctuations.
3️⃣ Set alerts: TradingView notifications allow you to react to real-time RSI movements instantly.
4️⃣ Apply to multiple markets: Effective for crypto, forex, stocks, and commodities.
Why Use RSI Signal Pro Instead of Standard RSI?
While RSI Signal Pro maintains the core functionality of the standard RSI, its real-time signal generation allows traders to make faster decisions without the typical delay caused by waiting for candle confirmations. Additionally, the optional momentum filtering and moving average smoothing ensure fewer false signals and better trade accuracy.

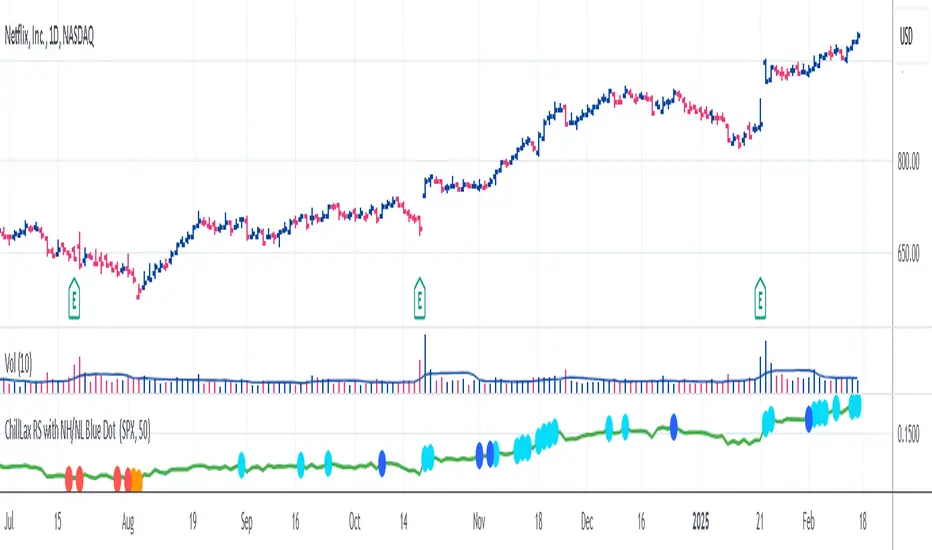
ChillLax Relative Strength Line with NewHigh NewLow Blue DotThis is similar to the IBD MarketSurge (MarketSmith) Blue Dot:
This plots the Relative Strength line vs. an index (default index is SPX), with a Dot when the RS line is hitting a New High.
If the RS hits a New High over the past X bars (default is 50), it shows a Light Blue (user definable) Dot on the RS line, if RS hits New High before the instrument hits New High, it shows a bigger/darker Blue Dot. Reverse for New Lows (orange for RS NL, Red for RS NL before Price NL)
This Dot is similar to the IBD Marketsurge RS New High Blue Dot, this indicator shows all the previous dots (MarketSurge shows only the last one). This on, unlike IBD, also shows RS New Lows. This one distinguishes RS NH before Price NH, and RS NL before Price NL. Lastly, IBD's lookback period is 52 week, here it is default to 50 days, but it is changeable.
RSI DeviationAn oscillator which de-trends the Relative Strength Index. Rather, it takes a moving average of RSI and plots it's standard deviation from the MA, similar to a Bollinger %B oscillator. This seams to highlight short term peaks and troughs, Indicating oversold and overbought conditions respectively. It is intended to be used with a Dollar Cost Averaging strategy, but may also be useful for Swing Trading, or Scalping on lower timeframes.
When the line on the oscillator line crosses back into the channel, it signals a trade opportunity.
~ Crossing into the band from the bottom, indicates the end of an oversold condition, signaling a potential reversal. This would be a BUY signal.
~ Crossing into the band from the top, indicates the end of an overbought condition, signaling a potential reversal. This would be a SELL signal.
For ease of use, I've made the oscillator highlight the main chart when Overbought/Oversold conditions are occurring, and place fractals upon reversion to the Band. These repaint as they are calculated at close. The earliest trade would occur upon open of the following day.
I have set the default St. Deviation to be 2, but in my testing I have found 1.5 to be quite reliable. By decreasing the St. Deviation you will increase trade frequency, to a point, at the expense of efficiency.
Cheers
DJSnoWMan06

UM-Relative Strength Index with Trending EMA and Fill
Description
This is a different take on the traditional RSI - Relative Strength Index. This indicator turns the RSI line green when above 50 and red when below 50 making directional changes highly visual. Additionally, an exponential Moving Average is drawn of the RSI. The EMA is green when trending higher and red when trending lower. The area between the RSI and EMA lines are green when the RSI is above the RSI EMA and red when the RSI is below the EMA.
About
The RSI by itself is a good tool to determine trend with the colors. It can also be used to determined overbought and oversold extremes. The EMA of the RSI is a smoothing technique. The indicator can also be used to determine trend with the directional color changes.
Recommended Usage
I look for crossovers; bullish crossovers when the RSI crosses above the EMA AND the RSI crosses above 50. A bearish crossover is when the RSI crosses down through the EMA AND crosses below 50. It can also be used for trade confirmation; for example if the RSI EMA is green consider staying long. The indicator works on any timeframe and any security. I use it on smaller timeframes, 3 minute, 1 hour, and 3 hour, to better time entries/exits.
Default settings
The defaults are the author's preferred settings:
- RSI period is 10 using the open, high, low, and close for calculation. The additional data points using the OHLC give smoother effect.
- The EMA used by default is 34.
All parameters and colors are user-configurable.
Alerts
Alerts can be set on the indicator itself and/or alert on color changes of the EMA.
Helpful Hints:
Look for positive or negative crossovers.
Look for crosses above or below 50
Look for RSI divergences, for example if a security hits a new high, the RSI does not, this a sign of subtle weakness.
Draw trend lines on the RSI line. A violation of a recent trend line may indicate a change of trend for the security.
RSI AcceleratorThe Relative Strength Index (RSI) is like a fitness tracker for the underlying time series. It measures how overbought or oversold an asset is, which is kinda like saying how tired or energized it is.
When the RSI goes too high, it suggests the asset might be tired and due for a rest, so it could be a sign it's gonna drop. On the flip side, when the RSI goes too low, it's like the asset is pumped up and ready to go, so it might be a sign it's gonna bounce back up. Basically, it helps traders figure out if a stock is worn out or revved up, which can be handy for making decisions about buying or selling.
The RSI Accelerator takes the difference between a short-term RSI(5) and a longer-term RSI(14) to detect short-term movements. When the short-term RSI rises more than the long-term RSI, it typically refers to a short-term upside acceleration.
The conditions of the signals through the RSI Accelerator are as follows:
* A bullish signal is generated whenever the Accelerator surpasses -20 after having been below it.
* A bearish signal is generated whenever the Accelerator breaks 20 after having been above it.

MUJBOT - Multi-TF RSI Table
The "Multi-TF RSI Table" indicator is a comprehensive tool designed to present traders with a quick visual summary of the Relative Strength Index (RSI) across multiple timeframes, all within a single glance. It is crafted for traders who incorporate multi-timeframe analysis into their trading strategy, aiming to enhance decision-making by identifying overall market sentiment and trend direction. Here's a rundown of its features:
User Inputs: The indicator includes customizable inputs for the RSI and Moving Average (MA) lengths, allowing users to tailor the calculations to their specific trading needs. Additionally, there is an option to display or hide the RSI & MA table as well as to position it in various places on the chart for optimal visibility.
Multi-Timeframe RSI & MA Calculations: It fetches RSI and MA values from different timeframes, such as 1 minute (1m), 5 minutes (5m), 15 minutes (15m), 1 hour (1h), 4 hours (4h), and 1 day (1D). This multi-timeframe approach provides a thorough perspective of the momentum and trend across different market phases.
Trend and Sentiment Analysis: For each timeframe, the script determines whether the average RSI is above or below the MA, categorizing the trend as "Rising", "Falling", or "Neutral". Moreover, it infers market sentiment as "Bullish" or "Bearish", based on the relationship between the RSI and its MA.
Dynamic Color-Coding: The indicator uses color-coding to convey information quickly. It highlights the trend and sentiment cells in the table with green for "Bullish" and red for "Bearish" conditions. It also shades the timeframe cells based on the RSI value, with varying intensities of green for "Oversold" conditions and red for "Overbought" conditions, providing an immediate visual cue of extreme market conditions.
Customization and Adaptability: The script is designed with customization in mind, enabling users to adjust the RSI and MA lengths according to their trading strategy. Its adaptable interface, which offers the option to display or hide the RSI & MA table, ensures that the tool fits into different trading setups without cluttering the chart.
Ease of Use: By consolidating critical information into a simple table, the "Multi-TF RSI Table" indicator saves time and simplifies the analysis process for traders. It eliminates the need to switch between multiple charts or timeframes, thus streamlining the trading workflow.
In essence, the "Multi-TF RSI Table" is a powerful indicator for Pine Script users on TradingView, offering a multi-dimensional view of market dynamics. It is ideal for both novice and experienced traders who seek to enhance their technical analysis with an at-a-glance summary of RSI trends and market sentiment across various timeframes.

Amazing Oscillator (AO) [Algoalpha]Description:
Introducing the Amazing Oscillator indicator by Algoalpha, a versatile tool designed to help traders identify potential trend shifts and market turning points. This indicator combines the power of the Awesome Oscillator (AO) and the Relative Strength Index (RSI) to create a new indicator that provides valuable insights into market momentum and potential trade opportunities.
Key Features:
Customizable Parameters: The indicator allows you to customize the period of the RSI calculations to fine-tune the indicator's responsiveness.
Visual Clarity: The indicator uses user-defined colors to visually represent upward and downward movements. You can select your preferred colors for both bullish and bearish signals, making it easy to spot potential trade setups.
AO and RSI Integration: The script combines the AO and RSI indicators to provide a comprehensive view of market conditions. The RSI is applied to the AO, which results in a standardized as well as a less noisy version of the Awesome Oscillator. This makes the indicator capable of pointing out overbought or oversold conditions as well as giving fewer false signals
Signal Plots: The indicator plots key levels on the chart, including the RSI threshold(Shifted down by 50) at 30 and -30. These levels are often used by traders to identify potential trend reversal points.
Signal Alerts: For added convenience, the indicator includes "x" markers to signal potential buy (green "x") and sell (red "x") opportunities based on RSI crossovers with the -30 and 30 levels. These alerts can help traders quickly identify potential entry and exit points.

Reverse Relative Strength Indicator [CC]The Reverse Relative Strength Index was created by Giorgos Siligardos (Stocks & Commodities V. 21:6 (18-30)). It is a handy indicator that reverse engineers the RSI price calculation to show what the price would have to be for the RSI value to match our chosen input. You can select your chosen RSI level using the RSI Level input for this indicator. For example if you wanted to see what the price would be for the RSI value to match the oversold level then you would set the RSI Level for 30 and it will plot that price on the chart. This uses some simple math to extrapolate the price with some basic algebra from the typical RSI calculation. This, of course, is a very similar concept to my previous Reverse Moving Average Convergence Divergence script. This indicator formula can be used for any oscillator with some slight tweaking and could also be customized to show the price for overbought and oversold levels, which I will probably do in the near future. This indicator is useful in many ways such as a trend indicator as my example shows or for a price projection tool. For example, if you had a current RSI level of 66 and it was going up and you want to see what the price would be if it reached the overbought level then you could do that. Let me know what works well for you and if you have any suggestions for how to further improve upon this script. I have included darker colors to show stronger signals and lighter colors to show normal signals. Buy when the line turns green and sell when it turns red.
I have a bunch of backlogged scripts that I'm trying to publish, so I figured I would focus on my RSI scripts since I have a bunch, so be prepared to see a bunch of those over the next week or so. Let me know if there are any other scripts you would like to see me publish!

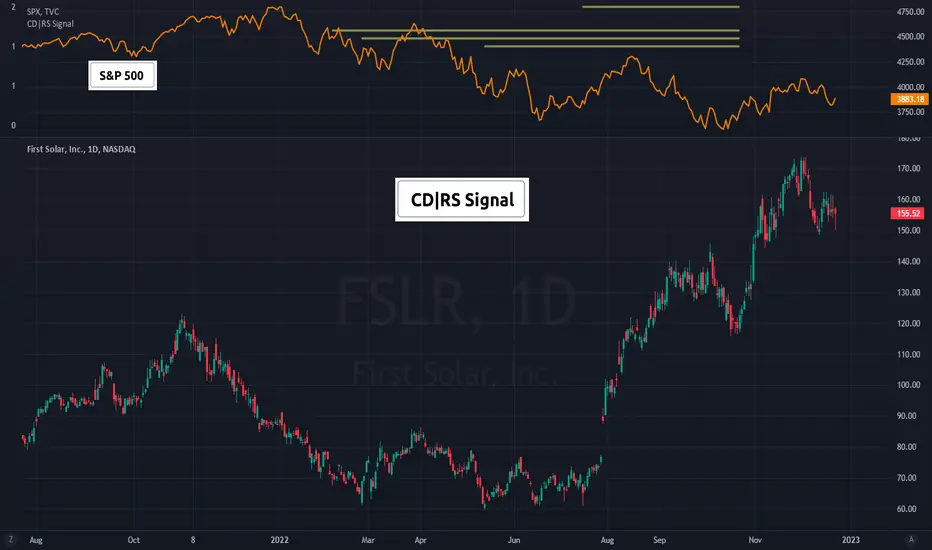
(CD|RS Signal) Caruso Divergence Relative Strength SignalCD|RS Signal allows for plotting horizontal bars to isolate periods where a security is forming a positive divergence from its benchmark, therefore, producing positive Relative strength when accounting for the security's volatility.
Investors can set how many 'pivots' or lows back to use when making an analysis. CD|RS Signal has an algorithm to identify pats market lows and automatically line them up with a stock's low around the same period of time. This allows for divergence analysis across many past lows and helps to isolate positive price divergences that are not so clear in choppy sideways trading action. CD|RS Signal helps an investor to identify when a security does not make a lower low vs a benchmark that has made a lower low over a similar period.
To help visualize the meaning behind the indicator, CD|RS Signal can be plotted in a separate pane, ideally over the benchmark itself. Traditionally the S&P500 is used for US stock analysis. By overlaying CD|RS Signal over the S&P 500, investors can more easily view which S&P 500 lows the stock is currently showing a positive divergence with.
This indicator allows you to select both your benchmark for comparing against as investors may prefer a commodity crypto currency or another stock. As well, users cans elect as far back to make the analysis by selecting the pivot lookback (how many prior ‘pivots’ or ‘market lows’ back to compare against).
In addition, to perform the historical study, investors can turn on historical HLs in the settings enabling all past CD|RS signals to show. This helps an investor to visualize how this has functioned on a security in the past.
(CA|RS Signal) Caruso Adaptive Relative Strength Signal CA|RS Signal is a new approach to relative strength analysis that incorporates a security’s volatility and correlation to a benchmark when performing RS analysis. Traditional RS methods compare the performance between two securities to identify which is outperforming on a percentage basis. although this is effective in many situations, some stocks are inherently less volatile and will not outperform a benchmark on a percentage basis. Accounting for a security's volatility and correlation to its benchmark through BETA allows for a more effective method to conduct RS analysis.
In order to build a tool that provides a robust signal, CA|RS Signal is a composite of RS from different time frames. The strongest trends have a security displaying RS across all timeframes measured. CA|RS Signal displays whether RS is identified along with how many internal components are currently identifying RS. This is helpful as a trend may progress from 3 components identifying RS down to only one as it wekas - providing early warning to an investor that RS is present but deteriorating.
CA|RS Signal is also adaptable to any time frame.
CA|RS Signal allows an investor to select which security will act as a benchmark. Traditionally, the S&P 500 is the benchmark for US stocks. International investors can select their local index of choice. Not equity investors can select a commodity, crypto token, or FX basket to get a different RS analysis.

DoubleRSI fast/slow signal buy/sell with alert Relative StrengthA combination of two Relative strength index. One fast and one slow line. In a system, this indicator can serve as an additional confirmation.
For example, for a long entry:
slow RSI cross above 50 level and fast RSI cross above 70 level. then check volume and use another indicator such as a MACD for extra confirmation
For example, for a short entry:
slow RSI cross below 50 and fast RSI cross below 30 level. then check volume and use another indicator such as a MACD for confirmation
An alarm function has also been added.
the following settings are possible:
- Source
- Length
- Color
I do not recommend to use this indicator alone.
have fun using this simple and helpful tool.

Comparative Relative Strength(CRS), ARS,SRS,Beta,RocShows comparative relative strength(CRS) against any benchmark script , if CRS is above ARS line than ARS is Positive and if CRS turns green than SRS is positive and vice versa.

Multi-Timeframe RSI GridThe relative strength index (RSI) is a momentum indicator that measures the magnitude of recent price changes to evaluate overbought or oversold conditions. The RSI is normally displayed as an oscillator separately from price and can have a reading from 0 to 100. This indicator displays the current RSI levels at up to 6 timeframes (of your choosing) in a grid. If the RSI levels reach overbought (above 70) or oversold (below 30) conditions, it changes the color to help you see that RSI has reached extreme levels. Note that in TradingView, when the chart is on a higher timeframe, the lower timeframe RSI levels don't calculate properly. If those conditions are met, this indicator will hide those values in the grid. If none of your selected values are available, it hides the table completely. There are configuration options, like:
Position the grid in any corner of the screen
Style customization (color, size)
Customize RSI length

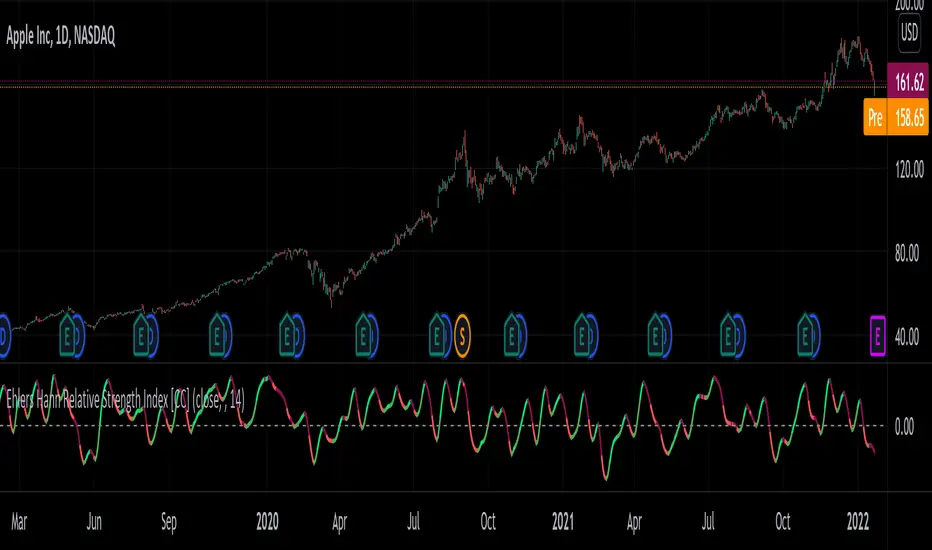
Ehlers Hann Relative Strength Index [CC]The Hann Relative Strength Index was created by John Ehlers (Stocks and Commodities Jan 2022 pgs 26-28) and this indicator builds upon his Hann Window Indicator to create an unique rsi indicator that doesn't rely on overbought or oversold levels to determine a reversal point and also provides a very superior smoothing without any of the lag associated with traditional smoothing. A much more useful RSI than the standard version in my honest opinion. Short term you buy when the line turns green and sell when it turns red. Medium to long term you buy when the indicator rises above the 0 line and sell when it falls below the 0 line. I have included strong buy and sell signals in addition to normal ones so strong signals are darker in color and normal signals are lighter in color.
Let me know if there are any other indicators or scripts you would like to see me publish!
RSI Levels, Multi-TimeframeThe relative strength index (RSI) is a momentum indicator that measures the magnitude of recent price changes to evaluate overbought or oversold conditions. RSI is normally displayed as an oscillator separately from price and can have a reading from 0 to 100. This indicator takes the RSI and plots the 30 & 70 levels onto the price chart so you can see when price is going to meet the 30 or 70 levels. The reason the 30 & 70 levels are important is because many traders (and bots) use those as signals to buy (at 30 RSI) or sell (at 70 RSI). Additionally, this indicator allows you to display not just the RSI levels of your currently viewed timeframe on the chart, but also shows the RSI levels of up to 6 different timeframes on the same chart. This allows you to quickly see if multiple RSI levels are aligning across different timelines, which is an even stronger indication that price is going to change direction when it meets those levels on the chart. There are a lot of nice configuration options, like:
Style customization (color, thickness, size)
Labels on the chart so you can tell which plots are the RSI levels
Optionally display the plot as a horizontal line if all you care about is the RSI level right now
Toggle overbought (RSI 70) or oversold (RSI 30) on/off completely

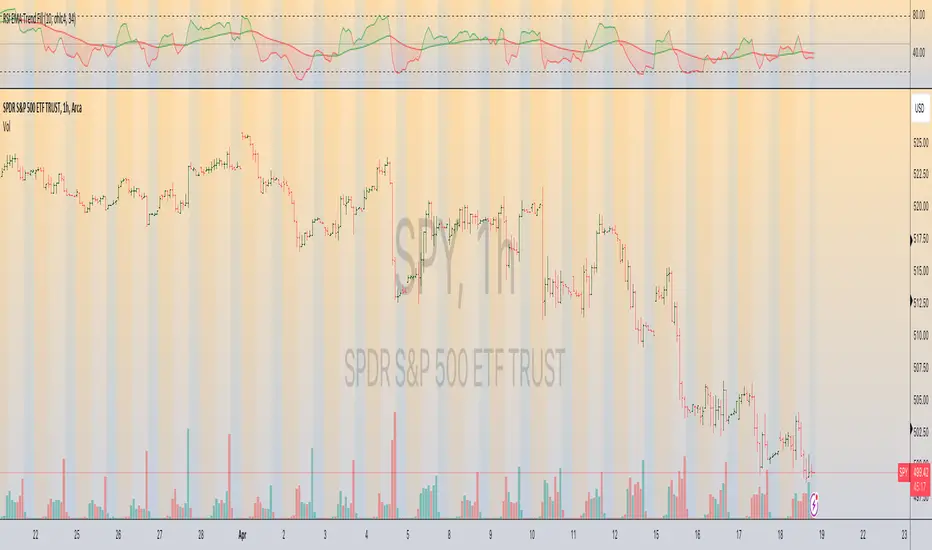
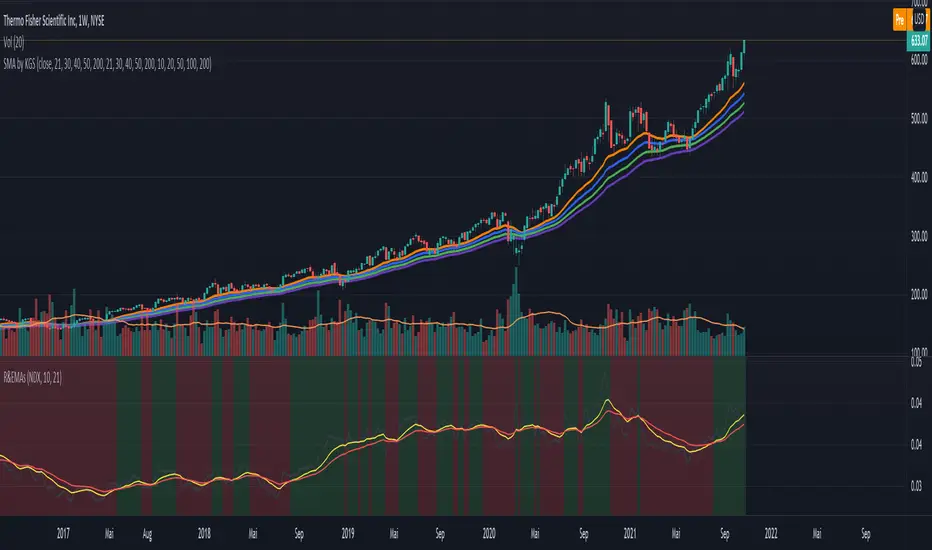
Ratio (Relative Strength) & EMAsRatio (Relative Strength) & EMAs
This indicator is used to compare the actual symbol with another one by calculating the ratio. EMA1 and EMA2 of the ration are shown as well. The idea is to choose an index like the NDX or SPX for comparison and to determine if the actual symbol outperforms the index or not - separate the wheat from the chaff. The rules are as follow:
When the calculation ratio (symbol divided ratio symbol) is above EMA1 and EMA1 is above EMA2) the background turs green. If not the background turn red.
QuantAnna: Relative Strength Plus (RS+)NSE:TATAMOTORS
Relative strength indicator which shows ratio between two stocks/assets .. usually between stock & its indices
features of indicator is as following.
1. Values oscillates around zero, it is bullish when above zero & bearish when below zero.
1. Weighted smoothing which removes unwanted whipsaws but keeps trend curve intact.
3. In-Built list of Nifty sector indices to show stocks comparison with its sector
please do send your feedback and suggestions.

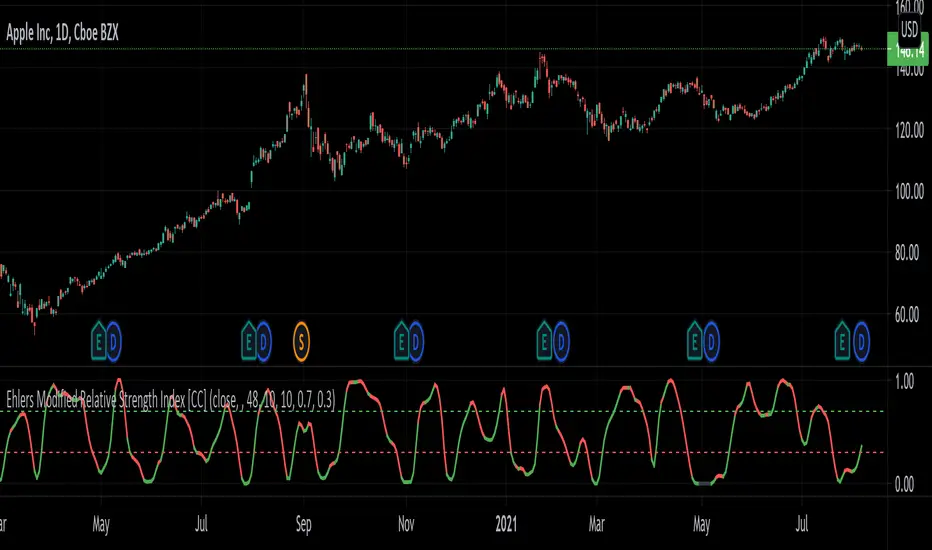
Ehlers Modified Relative Strength Index [CC]The Modified Relative Strength Index was created by John Ehlers (Cycle Analytics For Traders pgs 87-88) and this is a typical RSI that uses his roofing filter as the input. He smooths it with his own super smoother filter to provide signals. This indicator is extremely reactive and works in cycles so keep that in mind. I haven't been able to come up with clear buy and sell signals at this point so let me know if you any suggestions but I'm publishing the code to complete my goal of publishing all of his work one day. I will be publishing a bunch of Ehlers scripts in the next few weeks so stay tuned. What I recommend for buy and sell signals at this point are to buy when the indicator goes below the oversold line and starts going up and sell when the indicator goes below the oversold line a second time. Vice versa for sell signals.
Let me know if there are any other scripts you would like to see me publish!
Ehlers Adaptive Relative Strength Index V1 [CC]The Adaptive Relative Strength Index was created by John Ehlers and this is his first version. I will of course publish his updated version at a later date along with publishing the final script from Jim Sloman's Ocean Theory book. I have changed his script to include extra smoothing to provide clear buy and sell signals. This is a version of a RSI that is very adaptive to changes by finding the length of the current cycle and using that to calculate the rsi and I use this same basic process to provide extra smoothing. A great strategy of course is to buy right after the indicator goes from below the oversold level to right above it and stay in until the indicator turns red or when it reaches the overbought level. I have included strong buy and sell signals in addition to normal ones and the darker colors mean strong signals and lighter colors are normal signals.
Let me know what other indicators you would like to see me publish!
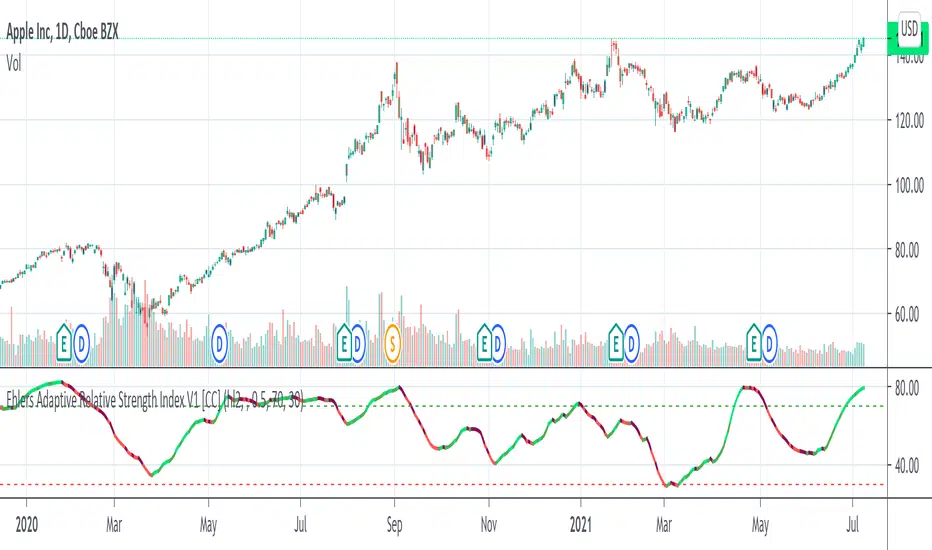
Table: Relative Strength Index (Multiple Timeframes) DESCRIPTION
It is the most popular and dependent Indicator, Relative Strength Index (RSI) . Now, I put inside a table to view chart momentum from Multiple timeframes.
This indicator tells different Timeframe (30 minutes, 1 hour, 4 hour, 1 day, 1 week, 1 month) of RSI value within table form.
HOW TO USE
Can consider a Long position when all timeframes go oversold while Short position when all timeframes go overbought. Alarm function is available. It sounds as all timeframes are overbought or oversold.
Modified The source of indicator from ©BeeHolder named "Performance"

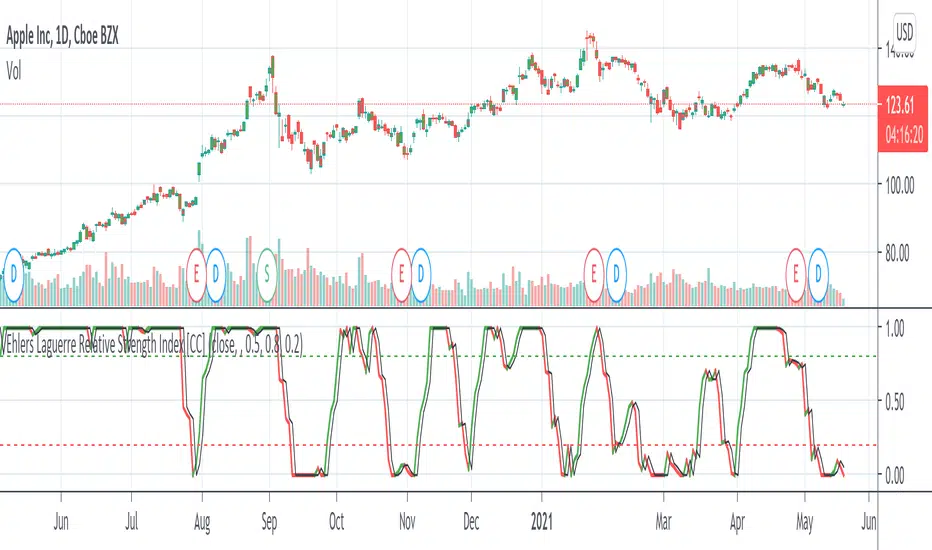
Ehlers Laguerre Relative Strength Index [CC]The Laguerre Relative Strength Index was created by John Ehlers and this is essentially his version of the RSI but I find that the buy and sell signals work better with his version as you can see. Buy when the line turns green and sell when the line turns red.
Let me know if there are any other indicators you want me to publish!
Cryptos Relative Strength Oscillator
This is an oscillator made of biggest 40 cryptocurrency/USDT pairs.
* It shows relative strength and change of crypto market during certain time on given interval.
* The tool has a bunch of data put together into one oscillator:
* top and bottom lines are made of 3 strongest and 3 weakest crypto pairs (out of 40)
* has visible names of that pairs for several candles back (it cannot show more due to TV's Pine limitations)
* in settings you can set up 2 methods of calculations:
1) % change from SMA of price, default is SMA 5
2) % changes from x-candles back, to see that change from the last candle please turn of 'Moving Average' and set up 'Bars Back' to 1
* you can change source to close/hl2/ohlc2/etc
Notice 1:
- to have nicer visibility of whole oscillator make it bigger part of whole screen then you normally use for other oscillators
Notice 2:
- scroll your mouse to widen the horizontal axis, so names of certain crypto pairs will be more readable
Notice 3:
- script has 40 Pine security functions (to gather all the data from all pairs) so it can load up to several seconds
- also every change in settings will possibly result in longer loading time
ps. This script is invite-only for the members of our trading group (info in signature, group is free of charge).
